Understanding and analyzing data effectively is crucial for making informed decisions. With dashboard insights, users can easily delve deeper into their data and extract actionable insights. This functionality enhances the data analysis experience by providing several key features.
Key Features of Dashboard Insights
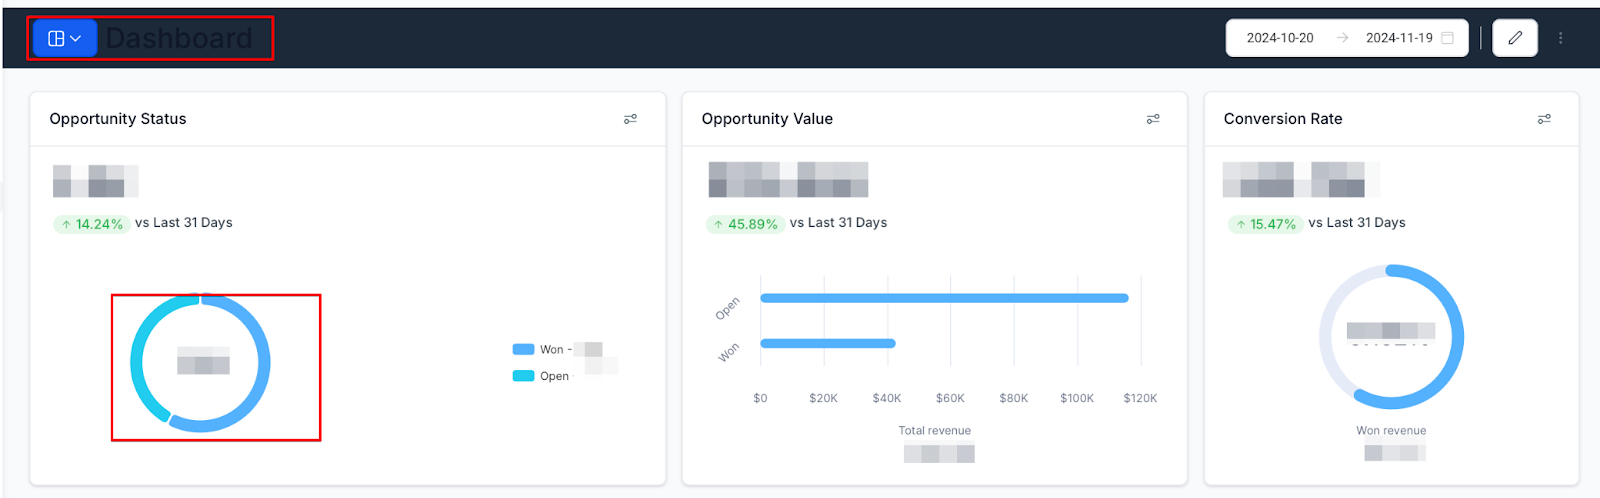
Clickable Graphs
Every widget on your dashboard is interactive. Whether it's a node on a line graph or a bar in a bar chart, clicking on any component reveals more detailed data. This interactivity transforms static visuals into gateways for deeper insights.
Record View
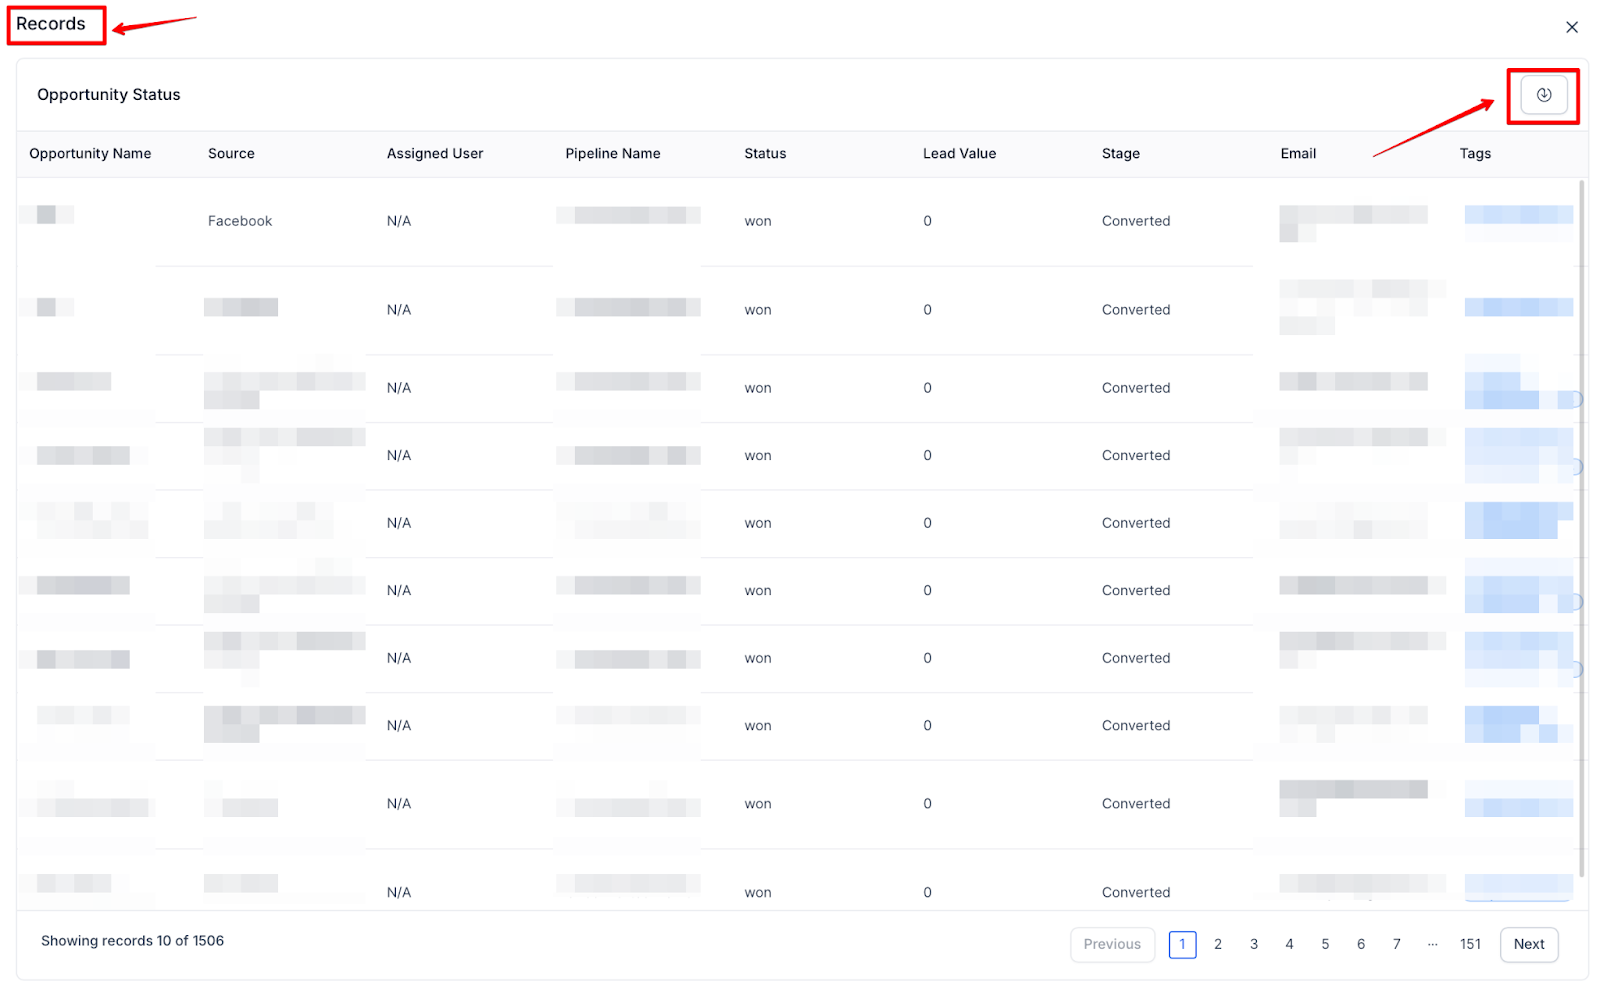
Upon clicking a graph component, a detailed table view of the underlying records appears. This intuitive table displays essential fields and parameters, giving a comprehensive view of the data behind the metrics. This feature helps understand the specifics that contribute to the overall numbers, making the analysis more informed.
CSV Export
For those who need to take their analysis further, there is an export feature. With a simple click, users can export detailed records as a CSV file. This is particularly useful for table widgets, allowing for further manipulation and examination of data in external tools.
How It Works
Navigating the Dashboard
- Access Your Dashboard: Start by logging into your account and navigating to your main dashboard.
- Interact with Widgets: Click on any node or bar in your graphs to open a detailed view of the underlying data.
- Explore Record View: Examine the available table list, showcasing all relevant fields and parameters.
- Export Data (Optional): If needed, click the export button to download your records as a CSV file for further analysis.
Benefits of Dashboard Insights
Streamlined Analysis
Dashboard insights eliminate the guesswork from data analysis. With clickable graphs and detailed record views, users gain a clearer understanding of their data, allowing for smarter, data-driven decisions.
Enhanced Efficiency
Accessing and analyzing data becomes faster and more intuitive. There is no need to jump through hoops to extract important information. Dashboard insights simplify the process, making it easier to obtain the necessary insights.
Best Practices
Continuous Monitoring
Regularly check your dashboard and interact with the widgets to stay updated on key metrics. This proactive approach helps catch trends and anomalies early, ensuring timely actions.
Data Exporting
While exporting data, ensure not to switch tabs or close the window until the export is complete. This guarantees a smooth and successful data extraction process.
Avoid Third-Party Dependencies
Currently, some dashboard insights may not support widgets dependent on third-party services like social media platforms. Focus on using native widgets for a seamless experience.
FAQs
- What are Dashboard Insights?
- Dashboard Insights are features within your dashboard that enhance data analysis by making graphs and widgets interactive. Users can click on graph components, view detailed records, and export data as CSV files, providing deeper insights and a more comprehensive understanding of the data.
- How do I interact with the widgets on my dashboard?
- To interact with widgets, simply click on any node, bar, or component within the graph. This will reveal a detailed table view of the underlying data, allowing you to explore the specific records contributing to the metrics displayed.
- What happens when I click on a component of a graph?
- Clicking on a component of a graph, such as a node on a line graph or a bar in a bar chart, opens a detailed record view. This table displays essential fields and parameters, giving a comprehensive look at the data behind the metrics.
- Can I export the data I see in the dashboard?
- Yes, you can export detailed records as a CSV file. This feature is particularly useful for table widgets and allows you to further manipulate and analyze the data in external tools like Excel or Google Sheets.
- How can Dashboard Insights improve my data analysis?
- Dashboard Insights streamline the analysis process by making it easy to interact with data directly on the dashboard. Clickable graphs and detailed record views eliminate guesswork, providing a clearer understanding of your data, and enabling smarter, data-driven decisions.
- What are the best practices for using Dashboard Insights?
- Regularly check your dashboard and interact with the widgets to stay updated on key metrics. When exporting data, ensure not to switch tabs or close the window until the export is complete. Focus on using native widgets to avoid compatibility issues with third-party dependencies.
- Can I use Dashboard Insights for widgets linked to third-party services?
- Currently, some dashboard insights may not support widgets that depend on third-party services like social media platforms. For a seamless experience, it is recommended to use native widgets provided within the platform.
- How do I navigate to the dashboard?
- To access your dashboard, log into your account and navigate to the main dashboard. From there, you can interact with the various widgets and features to explore and analyze your data.
- What types of data can be exported from the dashboard?
- You can export detailed records associated with any interactive graph or table widget on your dashboard. This data is exported in CSV format, which is ideal for further analysis or reporting in external applications.
- Why is continuous monitoring of the dashboard important?
- Continuous monitoring allows you to stay updated on key metrics and quickly identify trends or anomalies in your data. By interacting regularly with the dashboard, you can make timely, informed decisions that benefit your business.
- What should I do if I experience issues while exporting data?
- Ensure you do not switch tabs or close the window during the export process. If issues persist, check your internet connection or try exporting the data again. If the problem continues, contact support for assistance.
Was this article helpful?
That’s Great!
Thank you for your feedback
Sorry! We couldn't be helpful
Thank you for your feedback
Feedback sent
We appreciate your effort and will try to fix the article